


- THC% alone is a poor predictor of effect intensity — terpene profile, CBD content, and consumption method matter more
- Cannabis testing labs have ±3–5% accuracy variance; “lab shopping” by producers inflates reported numbers
- 15% THC from one batch does not equal 15% from another — bioavailability varies significantly between products
- Individual differences in endocannabinoid system sensitivity mean the same THC% produces different blood-THC levels across users
- Average US cannabis THC content rose from ~4% in the 1990s to 15–25% today, with associated increases in anxiety and dependency risk
- Microdosing (2.5–5mg THC) still produces measurable effects; chasing maximum potency often reduces effect quality
What THC Percentage Actually Means
THC percentage on cannabis packaging measures the concentration of delta-9-tetrahydrocannabinol as a proportion of total product weight. A flower product labeled “20% THC” contains approximately 200mg of THC per gram. This number comes from laboratory testing of a sample from the batch — either using high-performance liquid chromatography (HPLC) or gas chromatography (GC), both of which have accuracy limitations.
The percentage figure represents total available THC, which includes both delta-9-THC (active) and THCA (the non-intoxicating acid precursor that converts to THC when heated). Most lab reports show both figures. The label number is typically calculated as: delta-9-THC + (THCA × 0.877), accounting for the mass loss during decarboxylation. Understanding this chemistry matters because raw THCA-rich flower that hasn’t been decarboxylated (heated) will not produce significant psychoactive effects despite a high THC% label.
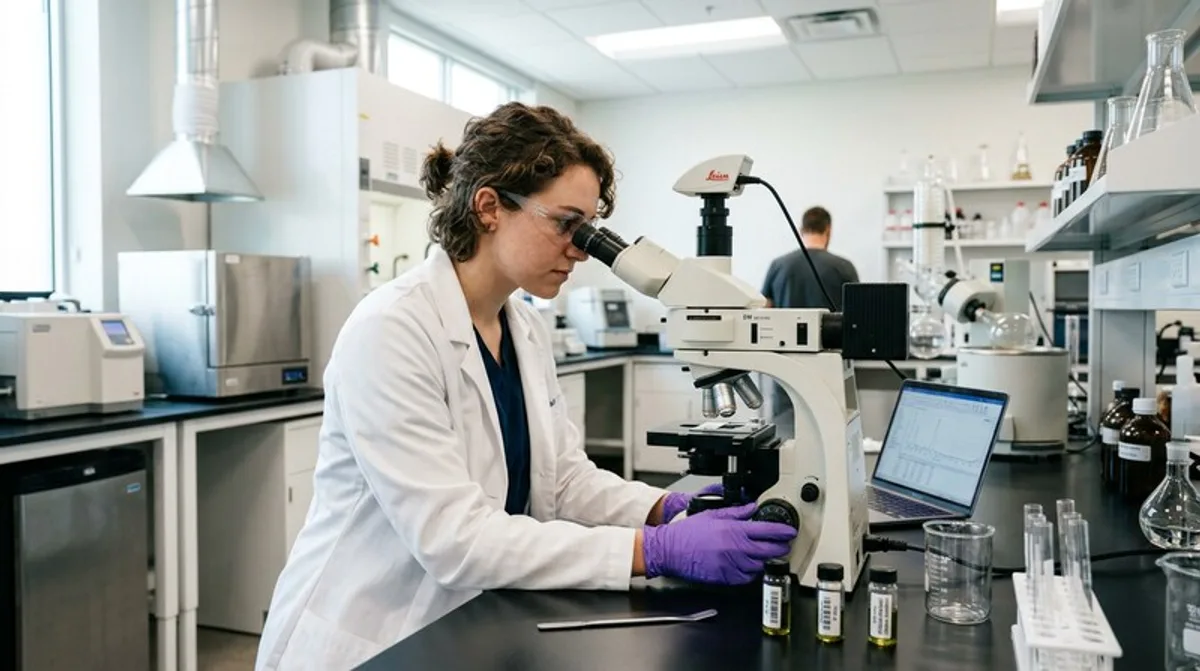
The Testing Accuracy Problem
Cannabis lab testing accuracy is a well-documented problem in the legal market. A 2019 study by researchers at the University of Northern Colorado sent identical cannabis samples to multiple licensed testing labs and found THC results varied by up to 11 percentage points for the same product. The typical inter-laboratory variance for THC testing is ±3–5 percentage points. This means a product that tests at 25% THC at one lab could test at 20% or 30% at another certified lab.
“Lab shopping” — the practice of cannabis producers submitting samples to multiple labs and selecting the highest result for packaging — is a recognized problem in markets with limited testing oversight. The practical result: numbers above 25% on consumer-facing packaging should be treated with particular skepticism, as they are more likely to be the result of favorable testing conditions than a genuine reflection of cannabinoid content.
Why 25% Is Not 2× Stronger Than 12%
Even setting aside testing accuracy, the subjective effect of cannabis does not scale linearly with THC percentage. Multiple factors intervene between the label number and the actual intoxicating effect experienced:
- Bioavailability ceiling: Inhaled cannabis has bioavailability of 10–35%, which varies by depth of inhalation, breath-holding, and individual lung capacity. Edibles have 4–20% bioavailability depending on gut metabolism. The same product consumed by two people can result in dramatically different blood-THC concentrations.
- CB1 receptor saturation: Above a certain blood-THC level, CB1 receptors are maximally activated — additional THC produces no additional effect. This ceiling varies by tolerance but means that moving from 20% to 35% THC produces diminishing returns for experienced users.
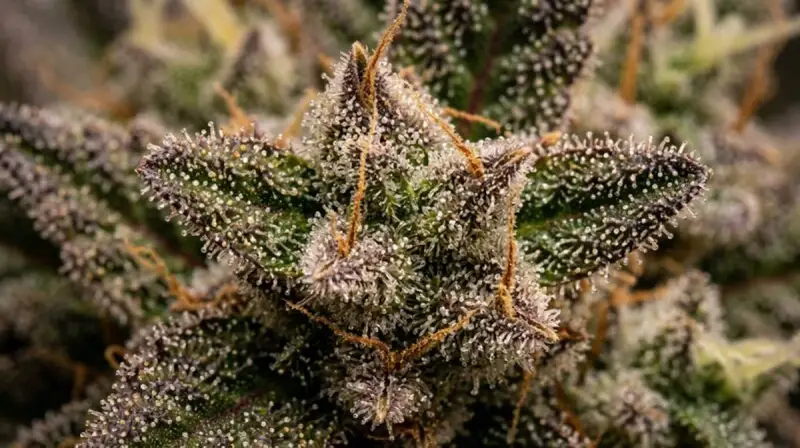
- Terpene entourage: Terpene profile modulates how THC activates CB1 receptors. A 15% strain with high myrcene and linalool may produce more profound relaxation and subjective intensity than a 28% strain with a thin terpene profile.
- Individual endocannabinoid system variation: Genetic differences in CB1 receptor density and endocannabinoid metabolism mean some people are pharmacologically more sensitive to THC than others at identical doses.
Potency by Product Type
| Product Type | Typical THC% | Bioavailability | Notes |
|---|---|---|---|
| Flower | 10–30% | 10–35% | Most variable; terpene profile matters most here |
| Hash / Kief | 20–60% | 15–35% | Traditional concentrate; terpenes largely intact |
| BHO (Butane Hash Oil) | 60–85% | 25–45% | Rapid, intense onset; higher anxiety risk |
| Live Resin | 60–90% | 25–45% | High terpene preservation; full-spectrum effect |
| Distillate | 85–99% | 25–45% | Terpene-stripped; high THC with flat effect profile |
| Edibles | 2–100mg per serving | 4–20% | Highly variable; 11-hydroxy-THC more potent than inhaled |
What Matters More Than THC%
If THC percentage is a misleading predictor of effect, what should consumers evaluate instead? Several factors are more reliable guides to the actual experience a product will produce:
- Terpene profile: The specific combination of terpenes (myrcene, limonene, linalool, caryophyllene, etc.) shapes the character of the effect far more than THC concentration within the typical consumer range (10–30%)
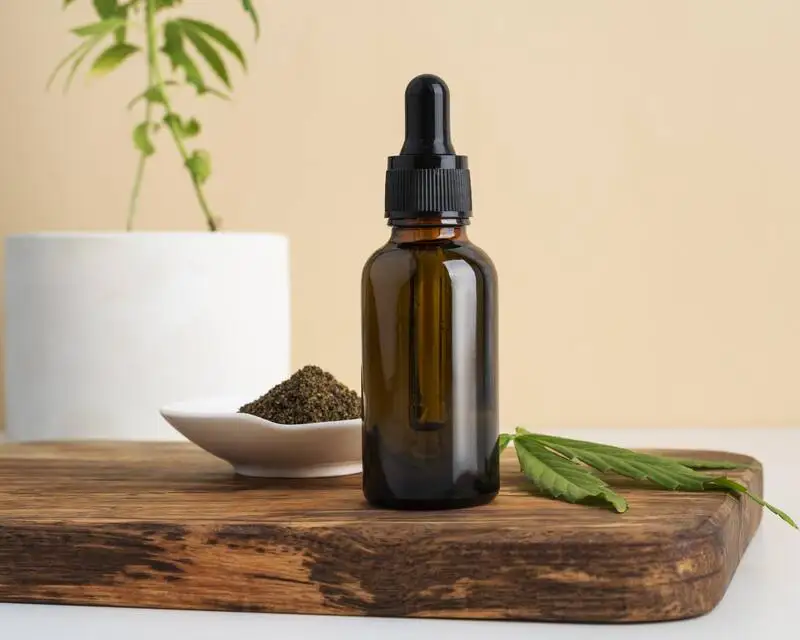
- CBD:THC ratio: Even small amounts of CBD (2–5%) meaningfully modify THC’s anxiety-inducing potential and extend the therapeutic window
- Consumption method: The delivery system changes both the onset kinetics and the effective dose — the same gram of 20% flower can produce very different effects depending on smoking vs. vaporizing temperature vs. edible extraction
- Individual tolerance: A tolerance-naive person at 15% will experience more intense effects than a daily user at 30%
- Product age and storage: THC degrades to CBN over time; improperly stored cannabis loses potency faster than the label reflects
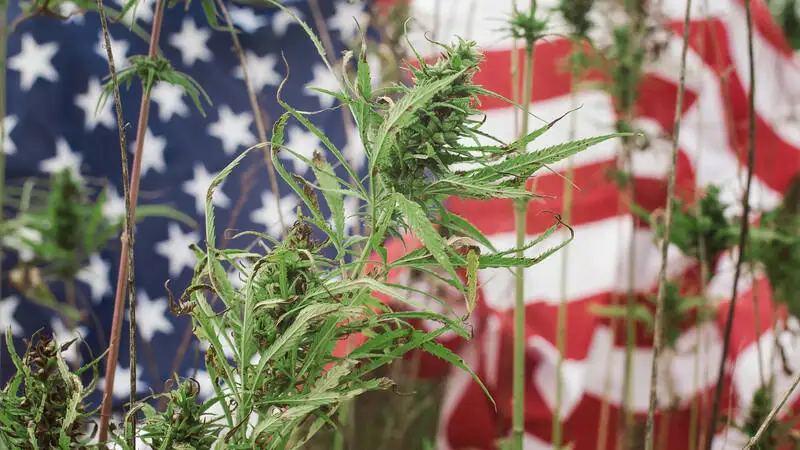
The Potency Arms Race
Average THC content in US legal market cannabis has increased dramatically: from approximately 4% in the 1990s to 15–25% in current legal market flower, with premium products regularly labeled at 25–35%. This increase has been driven by selective breeding and consumer preference for high-THC numbers, not by evidence that higher THC produces better outcomes.
The consequences are measurable. Higher-THC cannabis is consistently associated in the research literature with higher rates of cannabis-induced anxiety, higher rates of cannabis use disorder, faster tolerance development, and in vulnerable populations, higher rates of cannabis-associated psychotic episodes. The potency arms race has increased the risk profile of cannabis without proportionally increasing its benefits — a pattern the research community has documented extensively since legal markets expanded access to high-THC products.
Higher THC and Anxiety Risk
The dose-response curve for THC and anxiety is well-established. Low to moderate doses (up to approximately 10–15mg THC depending on individual sensitivity) produce CB1-mediated anxiolysis. Above this threshold, additional THC increasingly activates the very same pathways in an overstimulation pattern that triggers rather than reduces anxiety. This threshold is lower for: first-time users, people with anxiety disorders, people with certain CB1 receptor genetic variants, and users in anxious environmental contexts.
A 25% THC strain delivers roughly 250mg of available THC per gram. Even with conservative inhalation bioavailability estimates, a moderate smoking session could deliver 15–50mg of absorbed THC — well above the anxiety-threshold for many users. The same session with a 15% strain delivers proportionally less, with a correspondingly lower probability of crossing into anxiety-producing territory.
Potency Guide by Experience Level
| User Type | Recommended THC% (Flower) | Edible Dose | Notes |
|---|---|---|---|
| First-time user | 10–15% (with CBD) | 2.5–5mg | Avoid concentrates entirely; go slow |
| Occasional user (monthly) | 12–18% | 5–10mg | Check in with tolerance before increasing |
| Weekly user | 15–22% | 10–20mg | Optimal range for most people |
| Daily / experienced user | 18–28% | 20–50mg+ | Tolerance drives requirements; consider T-breaks |
Microdosing: Effective at Surprisingly Low Potency
Microdosing — consuming 2.5–5mg THC — produces measurable physiological and subjective effects even in experienced cannabis users, despite being below the threshold of noticeable intoxication. At these doses, the cortisol-suppressing, mood-modulating effects of CB1 receptor activation occur without the cognitive impairment or anxiety risk of larger doses. This makes low-potency products (10–14% THC flower, precisely dosed low-mg edibles) more useful for microdosing than high-potency products, where the same small portion contains a larger and harder-to-control dose.
Frequently Asked Questions
Is higher THC cannabis stronger?
Not reliably. Lab accuracy variance of ±3–5%, individual bioavailability differences, terpene profile, and CB1 receptor saturation all mean that THC% alone is a poor predictor. Two people consuming identical high-THC product often have dramatically different experiences based on individual pharmacology.
What is considered high potency cannabis?
Flower above 20% THC is generally considered high potency. Above 25% is very high potency. However, due to ±3–5% lab variance, a product labeled 25% could realistically be 20–30% depending on testing conditions. Concentrates (BHO, distillate) range from 60–99% THC.
Does THC percentage determine the high?
THC% is one factor among several. Terpene profile, CBD content, consumption method, individual tolerance, and bioavailability all significantly influence the subjective effect. Many experienced users report that 15–18% flower with a rich terpene profile produces a more satisfying experience than 28% flower with minimal secondary compounds.
What is a good THC percentage for beginners?
Beginners should start with flower in the 10–15% THC range, ideally with some CBD present. At this range, effects are noticeable but less likely to produce the overwhelming anxiety that high-THC products can trigger in first-time users. Avoid concentrates, vape cartridges with unlabeled potency, and edibles until tolerance is established.