THC Percentage Guide: Why the Number on the Label Is Misleading
The science behind why THC% is a poor predictor of potency — and what total cannabinoids, terpene profile, and consumption method actually determine your experience.
Senior Cannabis Editor at ZenWeedGuide. Specialist in cannabis pharmacology, the endocannabinoid system, and evidence-based effect guides.
Last reviewed: May 2026
The THC% Problem: What Research Says
THC percentage — the number printed prominently on dispensary menus and product labels — has become the dominant consumer buying signal in the legal cannabis market. High-THC products consistently outsell equivalent mid-range products, and producers have commercial incentives to report maximum possible THC values.
The scientific evidence, however, consistently challenges THC% as a meaningful potency metric. A landmark 2020 study by Bidwell et al., published in JAMA Psychiatry, recruited 121 cannabis users and measured their subjective experience after consuming their own choice of high-THC or lower-THC products. The result: users who purchased higher-THC flower or concentrate showed no significant advantage in reported positive effects. Critically, they showed higher impairment on cognitive and balance measures — demonstrating that high THC% increases negative effects without proportionally increasing desired effects.
What the Research Shows
THC% alone does not predict subjective potency in controlled trials
Total terpene % is a stronger predictor of experienced effect quality than THC%
Tolerance can nullify the effect of a 10–15% increase in THC% within days
Bioavailability differences between consumption methods create up to 5× variation in effective dose from the same labeled THC content
Lab testing variance of ±5% means two products labeled "30% THC" may actually contain 25–35% THC
The Tolerance Factor
Cannabis tolerance develops rapidly through CB1 receptor downregulation and desensitization. Daily cannabis users can develop substantial tolerance within 3–7 days of regular use — the CB1 receptors in the brain reduce in density and sensitivity in response to persistent THC stimulation.
The practical consequence: a daily user with significant tolerance consuming 25% THC flower may experience less psychoactive effect than a naive user consuming 15% THC flower. The absolute THC content is less important than the available CB1 receptor binding capacity in the individual consumer’s brain.
Tolerance also differentiates across effects. Users often develop tolerance to cognitive and psychomotor impairment faster than to subjective euphoria — which partly explains why experienced users can function normally at doses that would profoundly impair inexperienced users. This dissociation between different effects means THC% provides no meaningful information without knowing the consumer’s tolerance state.
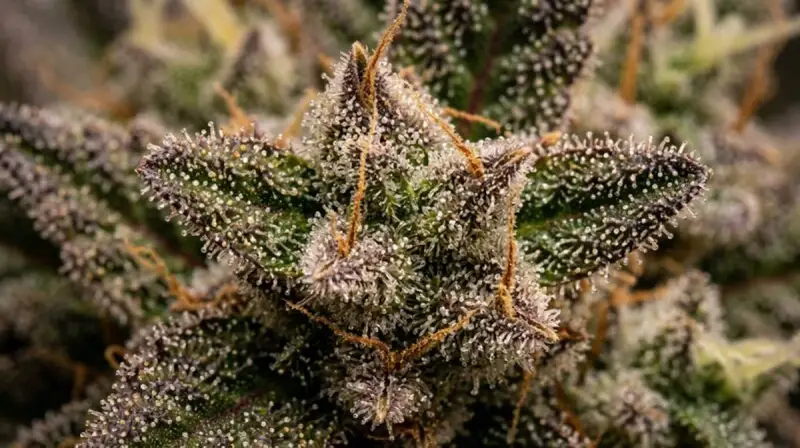
Terpene Synergy: The Missing Variable
The most significant variable omitted from THC% discussions is terpene profile. Terpenes modulate THC’s effects through multiple mechanisms: they alter blood-brain barrier permeability, modify CB1 receptor activity, and interact independently with serotonin, dopamine, and GABA systems.
Consider two hypothetical flowers:
Product A: 28% THC, 0.7% total terpenes — bright, cerebral onset that fades quickly
Product B: 22% THC, 2.8% total terpenes (myrcene-dominant with linalool and BCP) — more gradual onset, longer duration, full-body relaxation
Many experienced users consistently prefer Product B — not because it has higher THC, but because the rich terpene environment produces a more complex and sustained effect. The entourage effect means the whole is greater than the sum of THC alone.
Total Terpene %
Quality Descriptor
Entourage Potential
<0.5%
Low — old, poorly stored, or trim
Minimal
0.5–1.0%
Below average — standard commercial
Low
1.0–2.0%
Average — typical mid-tier flower
Moderate
2.0–3.5%
Good — craft or well-grown commercial
Strong
>3.5%
Exceptional — fresh, expertly cured craft flower
Maximum
Consumption Method and Bioavailability
THC% describes what is in the product. Bioavailability describes how much of it actually reaches the brain. The gap between these numbers is enormous and varies by consumption method — making THC% comparisons across methods essentially meaningless.
Method
Bioavailability
Effective THC from 100mg Labeled
Combustion (smoking)
30–50%
30–50mg
Vaporization
35–55%
35–55mg
Oral (edible)
10–20%
10–20mg (as 11-OH-THC)
Sublingual
20–35%
20–35mg
This means a consumer comparing a 25% THC vape cart to 25% THC flower is comparing products that will deliver meaningfully different effective doses even before factoring in terpenes, tolerance, or metabolic differences.
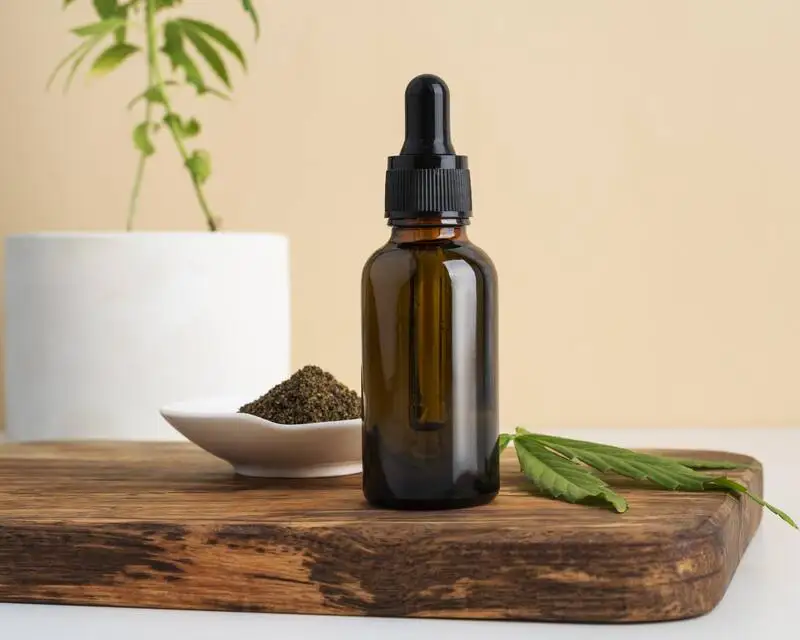
What Actually Matters: Total Cannabinoids + Terpenes
A more informative label would display:
Total activated cannabinoids (THCA + THC + CBGA + CBC + CBG + CBN) — representing the full cannabinoid payload
Total terpene percentage — the most reliable quality proxy
Specific dominant terpenes — for effect prediction (myrcene=sedating, limonene=uplifting, pinene=focus)
CBD:THC ratio — CBD modulates THC’s anxiety-inducing and psychoactive intensity
THCA, the raw acid form of THC in uncured or live flower, converts to THC via heat (decarboxylation). Some lab reports show only THC (already activated); others show THCA separately. A correct total THC estimate is: THC + (THCA × 0.877). Consumers comparing labels should verify whether the stated % is THC or total THC including THCA.
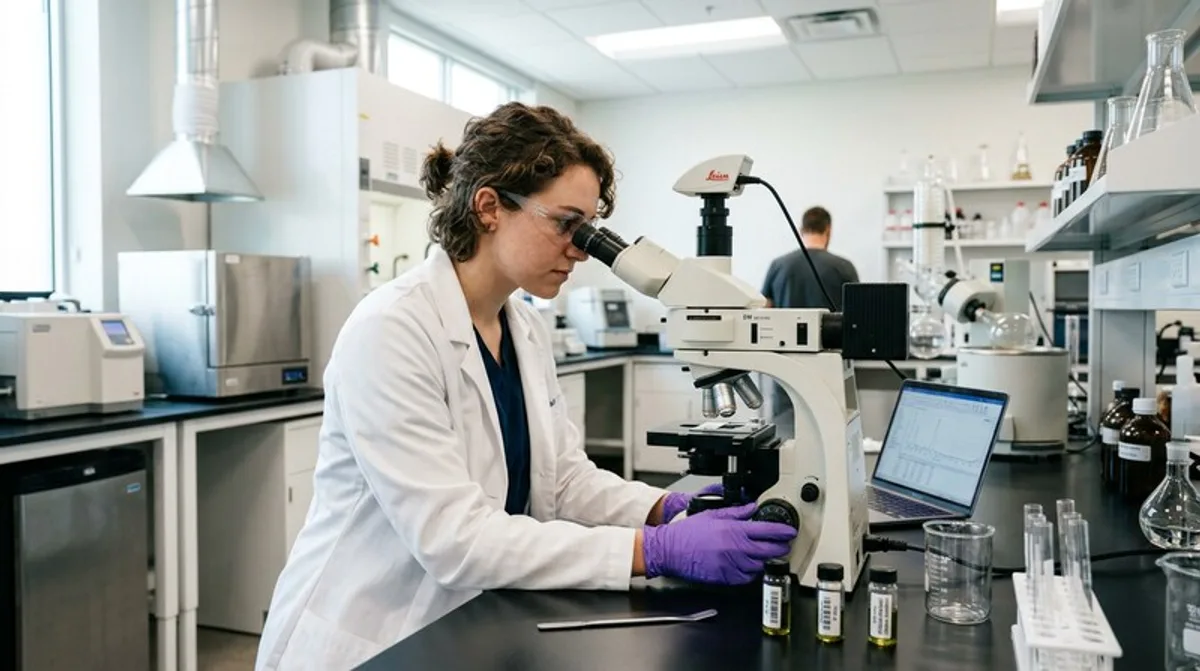
Lab Testing Accuracy: A Major Problem
Cannabis lab testing suffers from significant standardization issues in the US market. A 2023 study in PLOS ONE tested 23 samples at multiple accredited laboratories and found inter-lab variance averaging ±5.3 percentage points — meaning a true 25% THC product could be reported as anywhere from 19.7% to 30.3% depending on the lab.
Some laboratories inflate reported THC numbers to attract business from producers who know consumers buy based on THC% — a practice industry insiders call "lab shopping." Oregon’s OLCC began proficiency testing programs to address this, and California’s DCC has issued corrective actions against labs with consistently inflated results.
The practical implication: two products labeled 28% and 24% THC from different labs may actually contain identical amounts of THC. The number on the label is an estimate with substantial uncertainty.
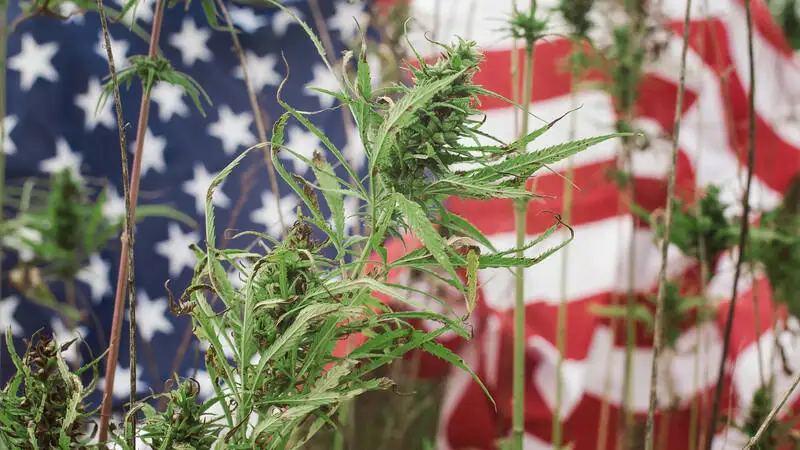
Marketing vs Reality: The THC Arms Race
Legal cannabis markets have experienced what researchers call "THC inflation" — a steady upward creep in reported THC percentages that does not reflect actual agricultural improvements. Average reported THC in Colorado dispensaries went from approximately 18% in 2014 to 26% in 2022, despite no comparable agricultural or genetic evidence that average plant THC actually doubled.
Simultaneously, consumer research shows that most experienced cannabis users cannot reliably distinguish flower with 20% THC from flower with 30% THC in blinded trials — consistent with the tolerance and terpene evidence that makes THC% a poor effect predictor.
Marketing-driven THC numbers benefit producers and dispensaries (higher prices for "stronger" products) but do not necessarily benefit consumers who overpay for an effect they could achieve at lower THC content with better terpene quality.
What to Actually Look For When Buying Cannabis
Ask for the terpene panel, not just THC%. Any reputable dispensary can provide the COA.
Target total terpenes above 1.5% for a reliable entourage effect.
Smell the flower if allowed — strong, complex aroma indicates terpene richness regardless of what the label says.
Check CBD content if you are anxiety-prone — even 0.5–1% CBD can meaningfully soften THC’s anxiety-inducing potential.
Ignore product names like "indica/sativa" — these have no pharmacological meaning. Look at the actual terpene profile.
Consider freshness — a 6-month-old 28% THC product will likely produce a weaker experience than a fresh 22% THC product with intact terpenes.
Frequently Asked Questions
No. Research consistently shows that THC percentage is a poor predictor of subjective potency for experienced cannabis users. Factors including terpene profile, consumption method, individual tolerance, bioavailability, and the presence of CBD and other cannabinoids all modulate the actual experience. Studies by Bidwell et al. (2020) found that users who purchased higher-THC products did not report stronger effects than those who purchased lower-THC products.
The entourage effect describes the modulation of THC’s effects by co-present cannabinoids and terpenes. CBD, for example, acts as a partial CB1 receptor antagonist at higher doses, dampening THC’s psychoactive intensity. Terpenes like myrcene and pinene modulate blood-brain barrier permeability and CNS neurotransmitter systems in ways that fundamentally alter the THC experience — independent of THC percentage.
Cannabis lab testing lacks standardization. Different labs use different analytical methods (HPLC vs GC-MS), different sample preparation protocols, and test different portions of the plant. A study published in PLOS ONE (2023) tested 23 cannabis samples at multiple laboratories and found average inter-lab variance of ±5.3 percentage points. Additionally, some labs inflate THC numbers to attract business — a practice known as "lab shopping."
Focus on total cannabinoid content (including CBG, CBC, CBN), total terpene percentage (above 1.5% is generally desirable for experienced users), and specific terpene profile rather than raw THC%. Freshness indicators like trichome integrity, moisture content, and aroma are strong proxies for terpene quality. A 22% THC flower with 2.5% total terpenes will typically outperform a 30% THC flower with 0.6% total terpenes for most experienced consumers.