


- Raw cannabis contains mostly THCA (non-psychoactive), not THC. The active compound is produced by decarboxylation (heat) using the formula: (THCa × 0.877) + delta-9 THC = Total THC.
- Cannabis lab testing carries inherent analytical variance of approximately ±3% — a product labeled 25% THC could legitimately test 22–28% at a different accredited lab on the same day.
- Commercial labs systematically overstate THC percentages by an average of 23% compared to reference laboratory results, according to a 2021 peer-reviewed study in Cannabis and Cannabinoid Research.
- Lab shopping — sending samples to multiple labs and reporting only the highest result — is a documented industry problem that inflates labeled THC% without benefiting consumers.
- A 2020 University of Colorado study found no statistically significant correlation between flower THC% and measured intoxication intensity in real consumers.
- DEA potency monitoring data shows average US cannabis THC has risen from ~4% in 1995 to ~15–17% in seized samples by 2023, though commercial dispensary flower is cultivated to higher concentrations.
- Terpene percentage is a more predictive quality indicator than THC% for most consumer outcomes; products with total terpenes below 0.5% are often degraded regardless of their labeled THC.
- Different product formats (flower, concentrate, edible) require completely different frameworks for interpreting potency numbers — THC% means different things across categories.
What THC Percentage Actually Measures
THC percentage — short for tetrahydrocannabinol percentage — is a measurement of how much of a specific cannabinoid is present in a cannabis sample relative to the sample’s total weight. It is expressed as a weight-per-weight percentage: a product labeled “22% THC” contains approximately 220 milligrams of the measured compound per gram of sample weight (1,000mg × 0.22 = 220mg/g).
The critical first complication is that raw, unheated cannabis does not primarily contain THC at all. It contains THCA (tetrahydrocannabinolic acid) — the acidic precursor to THC. THCA is non-psychoactive. Your body does not convert THCA to THC at body temperature; the conversion requires heat, specifically the process of decarboxylation, which removes the carboxylic acid group (CO2) from the THCA molecule. This happens during smoking, vaporization, and baking. Raw cannabis consumed without heat does not produce psychoactive effects from THCA.
When a dispensary menu lists “28% THC” on a flower product, what is almost always displayed is either: the THCA percentage alone (mislabeled as THC), the calculated total THC after applying the decarboxylation conversion formula, or sometimes the sum of THCA and delta-9 THC without the conversion factor. Inconsistency in what the label actually represents is a persistent problem in cannabis retail, and understanding the difference requires reading the actual COA rather than relying on the menu display number.
THCA vs. Delta-9 THC vs. Total THC: The Three Numbers
On a properly formatted Certificate of Analysis cannabinoid panel, you will see at minimum three cannabis-related numbers: THCA%, delta-9 THC%, and typically “Total THC%” (the calculated value). Here is what each means:
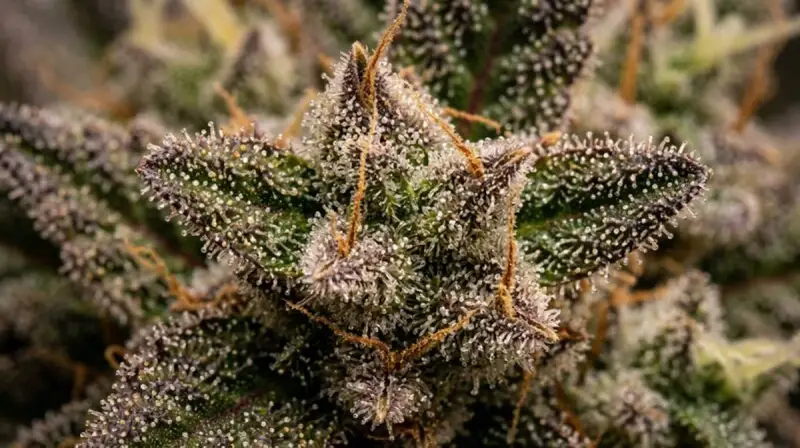
- THCA%: The concentration of tetrahydrocannabinolic acid in the raw sample. This is the dominant cannabinoid in most commercial flower — typically 15–30% by weight in dispensary-quality products. THCA is non-psychoactive until decarboxylated.
- Delta-9 THC%: The concentration of active, decarboxylated THC already present in the sample before heating. In properly cured flower, this is usually 0.1–2% — a small fraction of total cannabinoids. Cannabis that has been poorly cured, stored too warm, or exposed to prolonged light may show higher delta-9 as degradation has partially decarboxylated the THCA.
- Total THC%: The calculated maximum psychoactive THC available if the entire THCA content were perfectly decarboxylated. Formula: (THCA × 0.877) + delta-9 THC. This is the most useful single potency number for consumers, representing what is theoretically achievable with efficient combustion or vaporization.
Note that “total THC” is a theoretical maximum — no consumer achieves 100% decarboxylation efficiency in practice. Inefficient inhalation technique, combustion temperatures that are too high or too low, and incomplete vaporization all reduce actual delivered THC below the calculated total. The practical delivered THC through smoking is typically 20–37% of the labeled total THC, varying substantially with technique and device.
The Decarboxylation Formula: Worked Examples
The 0.877 conversion factor is derived from the molecular weights of THCA and THC. THCA has a molecular weight of 358.47 g/mol; THC has a molecular weight of 314.46 g/mol. The ratio is 314.46 ÷ 358.47 = 0.8773 — meaning that when 1 gram of THCA decarboxylates, the CO2 loss produces 0.877 grams of THC.
Practical worked examples:
| THCA% (from COA) | Delta-9 THC% (from COA) | Total THC Calculation | Total THC Result |
|---|---|---|---|
| 25.0% | 0.5% | (25.0 × 0.877) + 0.5 | 22.4% |
| 20.0% | 1.0% | (20.0 × 0.877) + 1.0 | 18.5% |
| 30.0% | 0.3% | (30.0 × 0.877) + 0.3 | 26.6% |
| 15.0% | 0.8% | (15.0 × 0.877) + 0.8 | 14.0% |
| 18.0% | 2.5% | (18.0 × 0.877) + 2.5 | 18.3% |
| 28.0% | 0.2% | (28.0 × 0.877) + 0.2 | 24.8% |
Notice that the “28% THC” product on a dispensary menu showing raw THCA may have a true total THC of only 24.8% — nearly 3.5 percentage points lower than the headline number. This gap is most significant at higher THCA concentrations and is one of the most consistent sources of confusion for cannabis consumers.
Testing Variance: The ±3% Problem
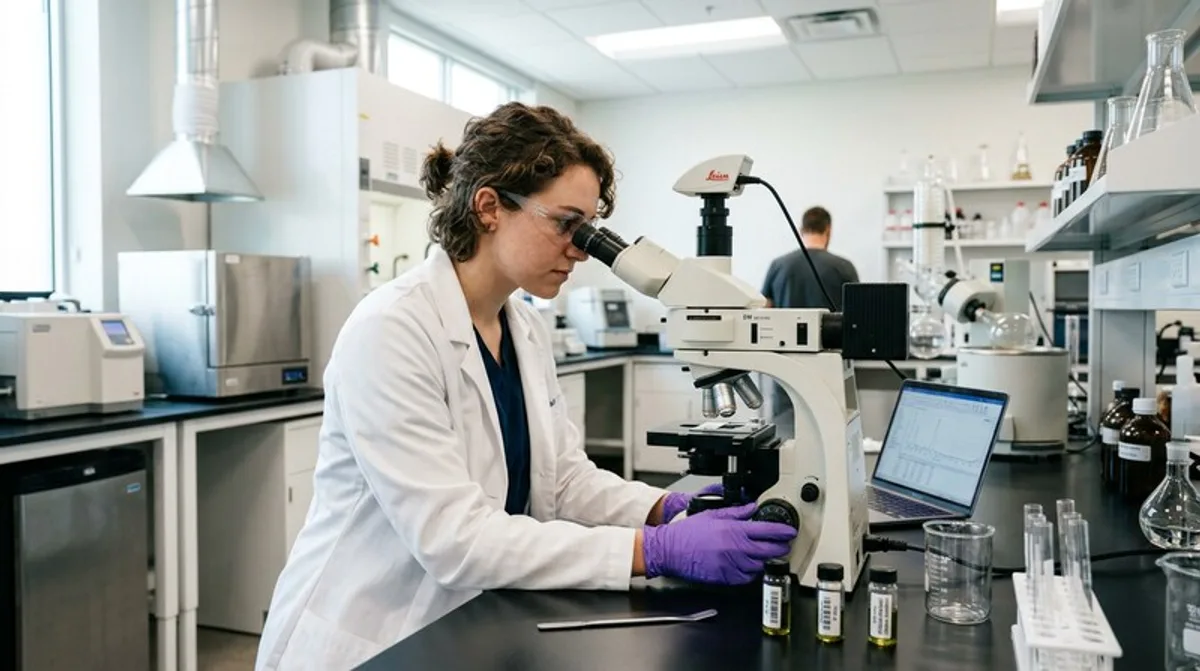
Even in a world of perfectly honest labs, cannabis THC testing has inherent analytical variance. This variance has multiple sources: the heterogeneity of the cannabis flower sample itself (different parts of the bud have different cannabinoid concentrations), instrument calibration differences between labs, sample preparation methodology (solvent choice, extraction technique), and the specific analytical method used (HPLC vs. GC).
Industry-accepted analytical variance for cannabis potency testing is approximately ±3% in absolute terms at typical potency levels. This means a product that “truly” contains 22% total THC could be reported as anywhere from 19% to 25% by different ISO 17025-accredited laboratories using correct procedures. This is not fraud — it is the unavoidable consequence of measuring a complex biological matrix with inherent heterogeneity.
The Lab Shopping Problem and Systematic Overstatement
Beyond natural analytical variance, a 2021 study published in Cannabis and Cannabinoid Research documented systematic and substantial upward bias in commercially reported cannabis THC percentages. Researchers obtained cannabis products from licensed Colorado dispensaries and tested them at a reference laboratory using validated reference methods. The commercial labs’ reported values exceeded the reference laboratory’s results by an average of 23.1%.
The cause is structural: cannabis producers competing for shelf space in a market where consumers disproportionately select high-THC products have financial incentives to submit samples to multiple labs and report only the highest result. Labs that report lower, more accurate values lose business to competitors willing to report higher numbers. Absent regulatory intervention requiring blind proficiency testing and inter-lab comparison programs, the commercial incentive for upward bias is self-reinforcing.
The practical consumer implication: a flower product labeled 28% THC at a licensed Colorado dispensary likely contains closer to 22–23% actual THC by reference standards. This does not mean the product is unsafe or mislabeled in a fraudulent sense — it is a systemic accuracy problem affecting the entire industry, not individual fraud. But it does mean that the labeled number should be treated as a rough directional reference, not a precise measurement, and that comparing THC percentages across different brands should account for the reality that different producers’ labs may be measuring differently.
State Regulatory Responses to Potency Inflation
Several state cannabis regulatory bodies have begun addressing potency inflation through inter-laboratory proficiency programs. Oregon requires licensed labs to participate in blind proficiency testing managed by OLCC. Colorado has implemented accreditation requirements and standardized testing methodologies for licensed labs. California’s Bureau of Cannabis Control has issued guidance on sampling and testing consistency. Massachusetts requires labs to perform precision and accuracy testing against reference standards. These programs are improving accuracy over time, but the 2021 study’s findings suggest the gap between commercial reporting and reference laboratory values remains substantial in most markets.
Research: Does THC% Predict the Experience?
The research on whether THC percentage actually predicts experience quality is now substantial and consistently points in the same direction: it does not, with meaningful reliability.
| Study / Source | Key Finding | Consumer Implication |
|---|---|---|
| University of Colorado / JAMA Psychiatry (2020) | No significant correlation between flower THC% and acute intoxication intensity in 121 real consumers measured in their own home environments | High-THC flower does not reliably produce a stronger experience |
| Cannabis and Cannabinoid Research (2021) | Commercial lab THC% overstated by 23% on average vs. reference laboratory; potency inflation documented across all sampled brands | Labeled % may not reflect actual content — direction correct, magnitude inflated |
| British Journal of Pharmacology (2011, Russo) | Terpenes modulate THC psychoactivity and therapeutic effects significantly via synergistic interactions (entourage effect) | Terpene profile is as important as, or more important than, THC% for experience quality |
| JAMA Psychiatry (2019) | Higher THC concentration associated with significantly increased acute anxiety and paranoia in non-regular cannabis users | Higher THC is not better for new users; risk of adverse effects increases with THC% |
| DEA Potency Monitoring Program (2023) | Average US seized cannabis THC has risen from ~4% (1995) to ~15–17% (2023) | Modern cannabis is objectively stronger than prior decades; new users should start lower than pre-legalization guidance suggested |
| Substance Use and Misuse (2022) | Concentrate users consuming 70–90% THC products showed only modestly higher blood THC than flower users; acute tolerance mechanisms appear to limit peak effect from concentrate | Diminishing returns may limit practical effect differences at very high THC concentrations |
The University of Colorado study is particularly important because it used real consumers in naturalistic settings — not controlled laboratory exposure — and measured both blood THC levels and subjective intoxication. The finding that there was no significant association between the THC% of the product consumed and the magnitude of the experience directly contradicts the dominant consumer belief that higher THC% = stronger high. Individual variation, tolerance, and the product’s full chemical profile account for far more variance than the headline number.
THC Percentages Across Product Categories
The same percentage label means very different things across different product categories because the total cannabinoid dose delivered per use varies enormously. Here is how to translate percentage into actual delivered dose across formats:
| Product Category | Typical THC% | Typical Use Unit | Approximate Delivered THC | Onset |
|---|---|---|---|---|
| Flower (budget) | 14–20% | 0.3g joint | ~12–18mg inhaled (bioavailability 20–37%) | 2–10 minutes |
| Flower (premium) | 22–30% | 0.3g joint | ~18–28mg inhaled | 2–10 minutes |
| Vape cartridge (distillate) | 70–85% | 1–3 second puff | ~2–5mg per puff (bioavailability 50–83%) | 1–5 minutes |
| Vape cartridge (live resin) | 60–80% | 1–3 second puff | ~3–6mg per puff; richer terpene profile | 1–5 minutes |
| BHO concentrate (shatter) | 70–90% | 0.1g dab | ~45–70mg (high bioavailability with proper temp) | 30–90 seconds |
| Live rosin | 65–80% | 0.1g dab | ~40–60mg; full-spectrum terpene effect | 30–90 seconds |
| Edibles (standard) | N/A — listed as mg | 1 piece (10mg standard serving) | ~2.5–5mg hepatic conversion to 11-hydroxy-THC | 30–90 minutes |
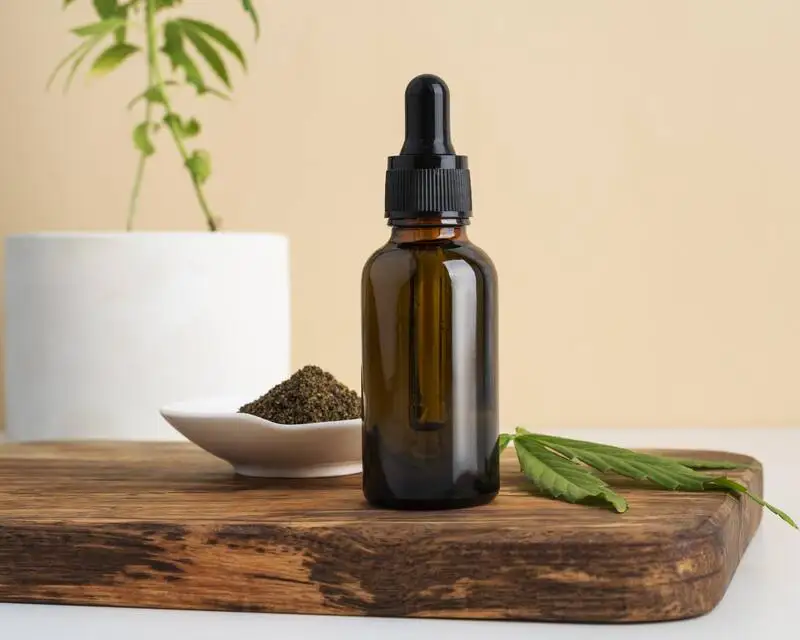
| Tincture (sublingual) | N/A — listed as mg/mL | 1mL dropper (e.g. 10mg) | ~6–8mg sublingual; ~3–5mg GI if swallowed | 15–45 minutes |
The edible comparison is particularly important: edibles are not labeled in percentage but in milligrams per serving. When cannabis is ingested, hepatic first-pass metabolism converts delta-9 THC into 11-hydroxy-THC, a more potent metabolite with enhanced blood-brain barrier penetration. This is why edibles feel “different” than inhaled cannabis at equivalent doses — they are chemically different compounds affecting the brain in different ways, not simply the same compound at the same concentration.
How to Choose Based on Percentage: A Consumer Framework
Given everything above, here is a practical decision framework for using THC% as one input — not the only input — in a cannabis purchase decision:
| Consumer Profile | THC% Starting Range | Also Check | Red Flags |
|---|---|---|---|
| First-time user | Flower: 10–15% | Edible: 5mg max | Vape: low-THC or CBD-dominant | CBD content; is there a 1:1 ratio option? | Any product over 20% THC; infused pre-rolls |
| Occasional recreational user | Flower: 15–22% | Edible: 5–10mg | Vape: standard cart | Dominant terpene; total terpene % | Products labeled 30%+ without terpene panel |
| Regular recreational user | Flower: 20–26% | Concentrate: entry-level rosin or live resin | Extraction method; live vs. cured | Unlabeled or undated products |
| Medical patient (anxiety/sleep) | Flower: 12–18% + CBD | Tincture: 1:1 or CBD-dominant | Full spectrum vs. isolate; caryophyllene and linalool content | High THC with no CBD; concentrate formats for anxiety use |
| High-tolerance experienced user | Flower: 24%+ | Concentrate: any | COA quality; batch freshness; terpene diversity | Tolerance building concern; consider periodic breaks |
| Micro-doser | Flower: 8–14% | Edible: 1–5mg | Tincture: low-dose mg/mL | Precision of dosing format; ml calibration | High-THC products or formats without dose precision |
Beyond THC: What the Full Cannabinoid Panel Tells You
A full-panel COA or detailed menu listing shows more than just THC. Understanding the minor cannabinoids gives a more complete picture of what a product will deliver:
CBD (cannabidiol): Modulates THC’s psychoactive and anxiogenic effects by competing at CB1 receptors and through allosteric modification. Even small amounts of CBD (4–8mg) can meaningfully reduce THC-induced anxiety in susceptible individuals. Products with even a modest CBD-to-THC ratio of 1:4 will feel different from a THC-only product of the same total potency.
CBG (cannabigerol): Often called the “mother cannabinoid” as it is the biosynthetic precursor to most other cannabinoids. Non-psychoactive. Some research suggests anti-inflammatory and neuroprotective properties. “CBG-dominant” strains have emerged as a consumer category.
CBN (cannabinol): A degradation product of THC formed over time with heat and light exposure. Mildly psychoactive. Often marketed in sleep products for its reported sedative properties, though the clinical evidence base is limited. Products with detectable CBN percentages may be from older harvests or include CBN as an intentional additive.
THCV (tetrahydrocannabivarin): A homolog of THC with distinct pharmacology. At low doses, THCV may act as a CB1 antagonist (opposing some THC effects). At higher doses, partial agonism. Often described as producing a clear-headed, energetic effect. Found in significant concentrations in some African sativa cultivars (Durban Poison, Doug’s Varin).
Understanding these minor cannabinoids provides a richer picture of what a product will deliver than THC% alone. Dispensary menus that provide full cannabinoid panels are giving consumers genuinely useful purchasing data — not just marketing numbers. See our COA reading guide for a complete panel interpretation guide and our terpene library for terpene-specific information.
Frequently Asked Questions
How do you calculate total THC from a lab report?
Total THC = (THCa × 0.877) + delta-9 THC. The 0.877 factor accounts for CO2 mass lost during decarboxylation. A product showing 24% THCa and 1% delta-9 THC has a total THC of (24 × 0.877) + 1 = 22.0%. This is why labeled percentages often differ from the raw cannabinoid panel numbers.
What is the testing variance in cannabis lab results?
Normal analytical variance is approximately ±3% in absolute terms. Beyond that, a 2021 study found commercial labs overstate THC by an average of 23% compared to reference lab results. Lab shopping — submitting to multiple labs and reporting only the highest — is a documented driver of this systematic overstatement.
Does higher THC percentage mean a stronger high?
Not reliably. A 2020 University of Colorado study found no significant correlation between flower THC% and measured intoxication in 121 real consumers. Terpenes, individual tolerance, CB1 receptor density, and consumption method all matter more than THC% as predictors of experience intensity.
What is the lab shopping problem in cannabis testing?
Lab shopping is the practice of sending samples to multiple labs and reporting only the highest THC result. It is structural — labs reporting lower, more accurate numbers lose business to competitors willing to report higher. Several states have implemented inter-lab proficiency programs to address this, but it remains widespread in most cannabis markets.